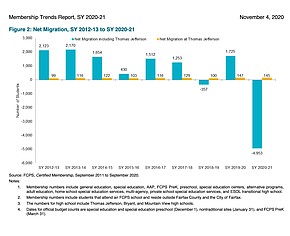
(Click on "Download .JPG" to see large chart.) The right-hand side of the bar graph shows the net migration trend at FCPS for SY 2020-21.
(Click on "Download .JPG" to see large chart.) The right-hand side of the bar graph shows the net migration trend at FCPS for SY 2020-21.